Legend Toggle Feature - Bug Fix in all Charts
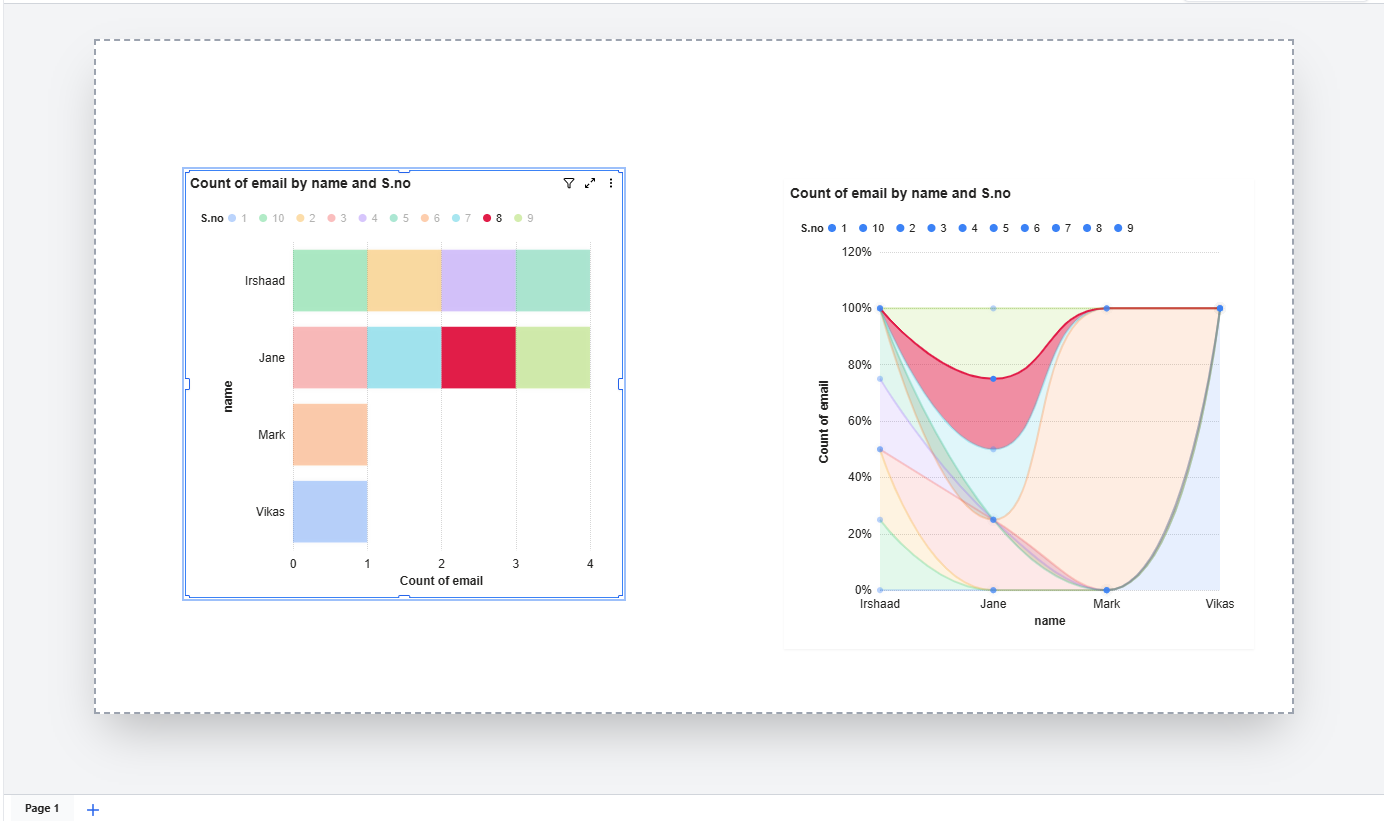
The issue was clicking on legend items in charts had no effect. Previously, when users clicked on a legend value (e.g., a series name like "1", "2", "3" shown at the top of a chart), the corresponding data series was not being hidden or shown as expected. This is a standard chart interaction that allows users to focus on specific data by toggling individual series on and off.
What was the problem:
The legend click was being intercepted by the chart container's drag-and-select behavior. When a user clicked on a legend item, the dashboard treated it as a container interaction (selecting/dragging the chart widget) instead of allowing the chart to process it as a legend toggle. This caused the chart to refresh before the legend click could complete, making the feature completely non-functional.
What has been fixed:
Legend toggle now works correctly — clicking on any legend item will hide that data series from the chart, and clicking it again will bring it back. The toggled state is also preserved when the chart refreshes or updates, so users won't lose their legend selections.
Charts where this fix applies:
- Stacked Bar Chart
- Stacked Column Chart
- Clustered Bar Chart
- Clustered Column Chart
- Horizontal Bar Chart
- Percent Stacked Bar Chart
- Percent Stacked Column Chart
- Stacked Area Chart
- Percent Stacked Area Chart
- Line Chart
- Area Chart
- Pie Chart
- Donut Chart
- Bubble Chart
- Bubble 3D Chart
- Radar Chart
- Scatter Trendline Chart
- Line & Column Combo Chart
- Line & Clustered Column Combo Chart
All other chart interactions such as clicking on data points, axis labels, tooltips, scrolling, zooming, drag-and-drop, and chart formatting continue to work as before.
Attachment: https://somup.com/cOe6iZVcnXk

 Updated by
  Updated by
  Updated by
  Updated by
  Updated by
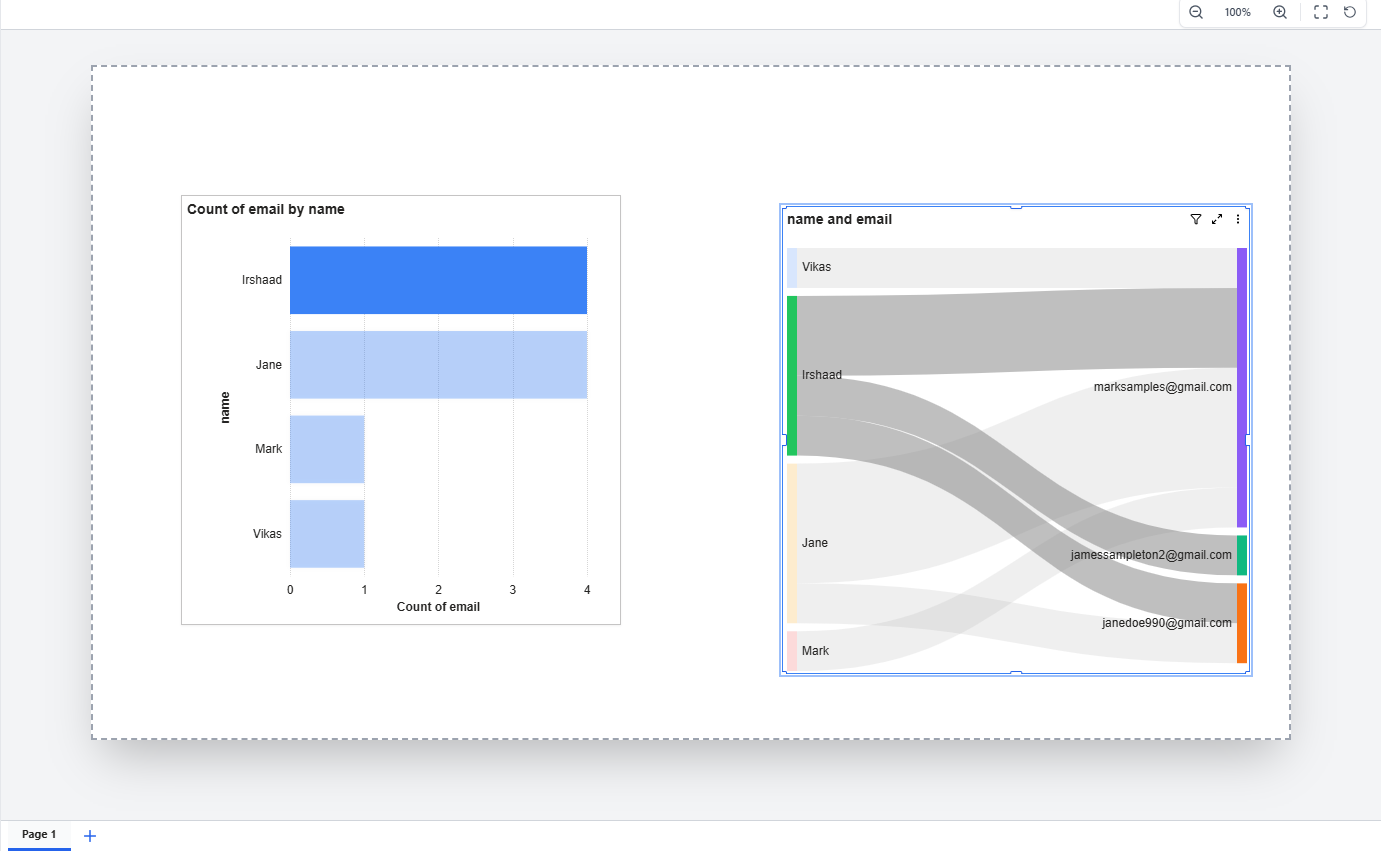