Bug #1132
open
Charts and Legends activation in Visualization Row section are not independent
Description
In the Visualization section → Row, the Charts activation and Legends activation options are not functioning independently. When a user clicks to activate one option (either Charts or Legends), the other option automatically becomes disabled or deactivated.
Both options should work independently so that users can activate either or both according to their visualization requirements. However, the current behavior restricts the user by allowing only one option to remain active at a time.
Files
 Updated by mirza asad about 1 month ago
- Assignee changed from mirza asad to Ghulam Mustafa
 Updated by Ghulam Mustafa about 1 month ago
- Status changed from New to In Progress
- Estimated time set to 1:00 h
Updated by Ghulam Mustafa about 1 month ago
- Assignee changed from Ghulam Mustafa to mirza asad
Updated by mirza asad about 1 month ago
- Assignee changed from mirza asad to ALi RAZA
 Updated by ALi RAZA about 1 month ago
This feature will be implemented on all 24 charts ASAP.
 Updated by Fareena Anayat about 1 month ago
- Project changed from 16 to Prism Release 2
- Target version deleted (
26Feb-7thMarch2026)
Updated by ALi RAZA about 1 month ago
- Status changed from New to Resolved
- % Done changed from 0 to 100
Legend Toggle Feature - Bug Fix in all Charts
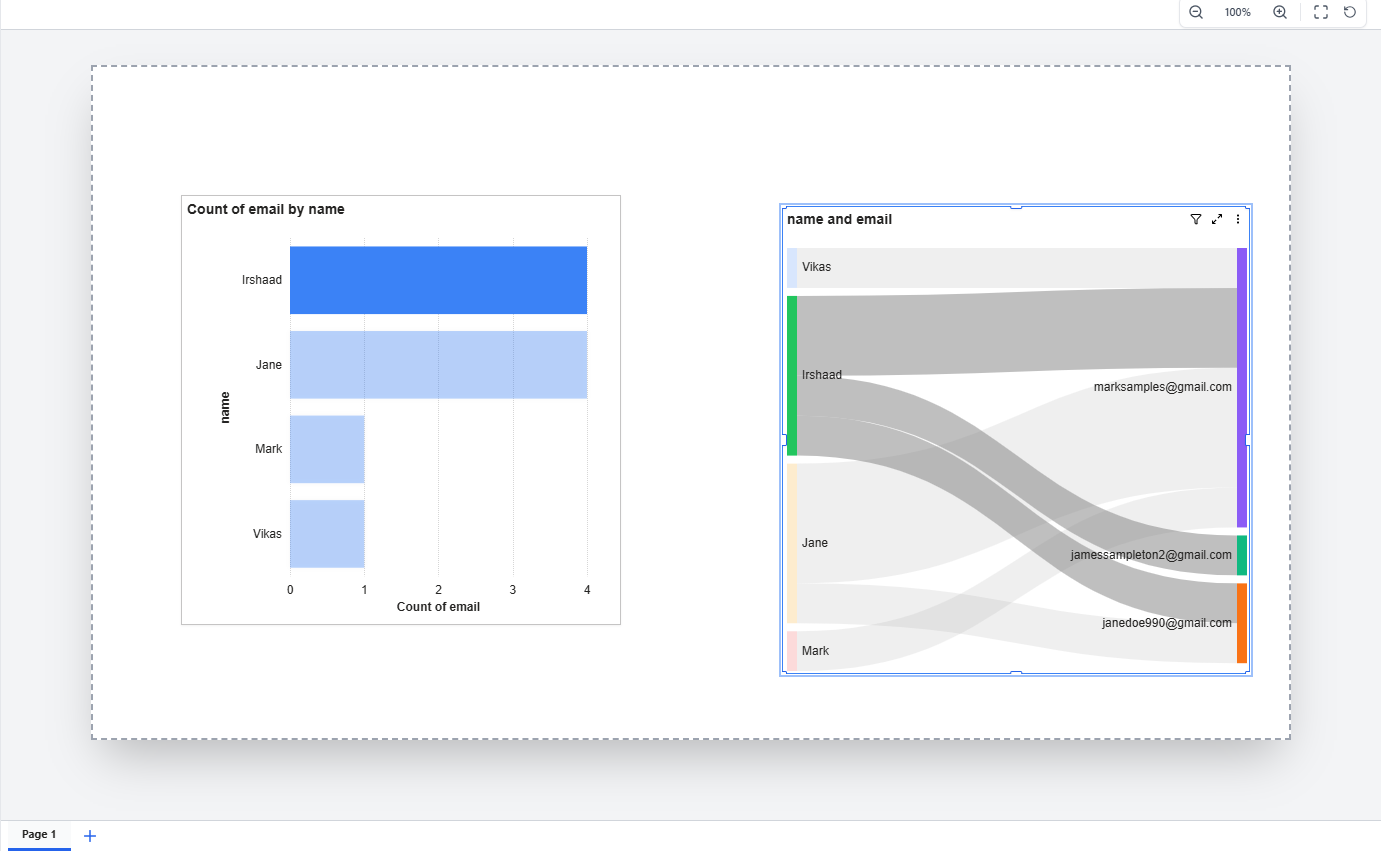
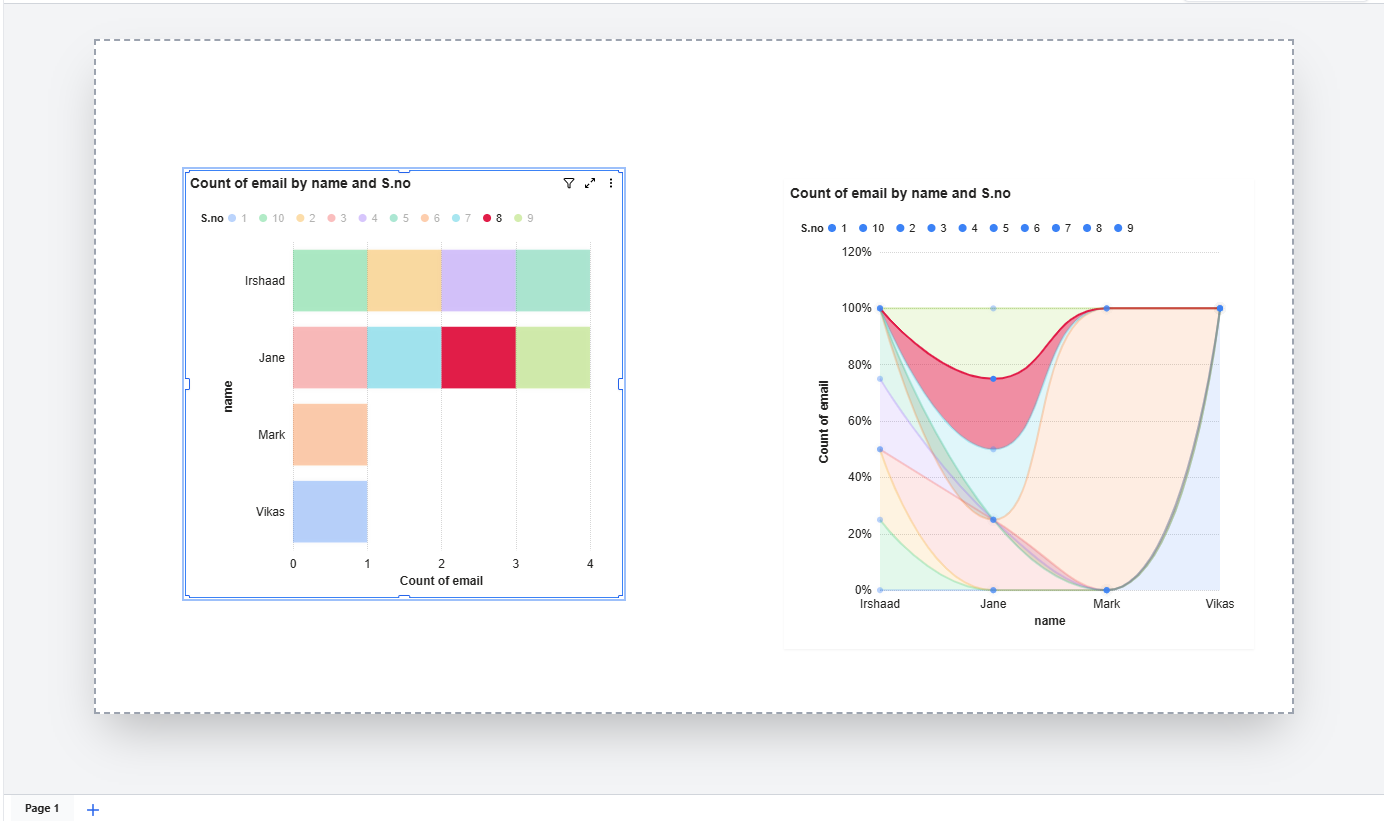
The issue was clicking on legend items in charts had no effect. Previously, when users clicked on a legend value (e.g., a series name like "1", "2", "3" shown at the top of a chart), the corresponding data series was not being hidden or shown as expected. This is a standard chart interaction that allows users to focus on specific data by toggling individual series on and off.
What was the problem:
The legend click was being intercepted by the chart container's drag-and-select behavior. When a user clicked on a legend item, the dashboard treated it as a container interaction (selecting/dragging the chart widget) instead of allowing the chart to process it as a legend toggle. This caused the chart to refresh before the legend click could complete, making the feature completely non-functional.
What has been fixed:
Legend toggle now works correctly — clicking on any legend item will hide that data series from the chart, and clicking it again will bring it back. The toggled state is also preserved when the chart refreshes or updates, so users won't lose their legend selections.
Charts where this fix applies:
- Stacked Bar Chart
- Stacked Column Chart
- Clustered Bar Chart
- Clustered Column Chart
- Horizontal Bar Chart
- Percent Stacked Bar Chart
- Percent Stacked Column Chart
- Stacked Area Chart
- Percent Stacked Area Chart
- Line Chart
- Area Chart
- Pie Chart
- Donut Chart
- Bubble Chart
- Bubble 3D Chart
- Radar Chart
- Scatter Trendline Chart
- Line & Column Combo Chart
- Line & Clustered Column Combo Chart
All other chart interactions such as clicking on data points, axis labels, tooltips, scrolling, zooming, drag-and-drop, and chart formatting continue to work as before.
Attachment: https://somup.com/cOe6iZVcnXk
Updated by Fareena Anayat 25 days ago
- Status changed from Ready For QA to Cycle 1
Not Fixed Yet
This highlighting is totally not work for
- Percent Stacked Area Chart
- Radar Chart
For All other charts, behaviour isn't accurate
https://somup.com/cOeb1CVc2jM
Updated by ALi RAZA 17 days ago
- File clipboard-202603251310-hwvym.png clipboard-202603251310-hwvym.png added
- File clipboard-202603251310-adw8j.png clipboard-202603251310-adw8j.png added
- Status changed from Cycle 1 to Resolved
Resolved - Charts and Legends activation in Visualization Row section are not independent.
 Updated by Maryam Farooq 15 days ago
- Assignee changed from ALi RAZA to Maryam Farooq
Updated by Fareena Anayat 15 days ago
- Status changed from Ready For QA to Waiting for Regression