Actions
Bug #956
open
Bubble / Scatter Chart in Prism does not match Power BI output when using identical dataset and field configuration
Description
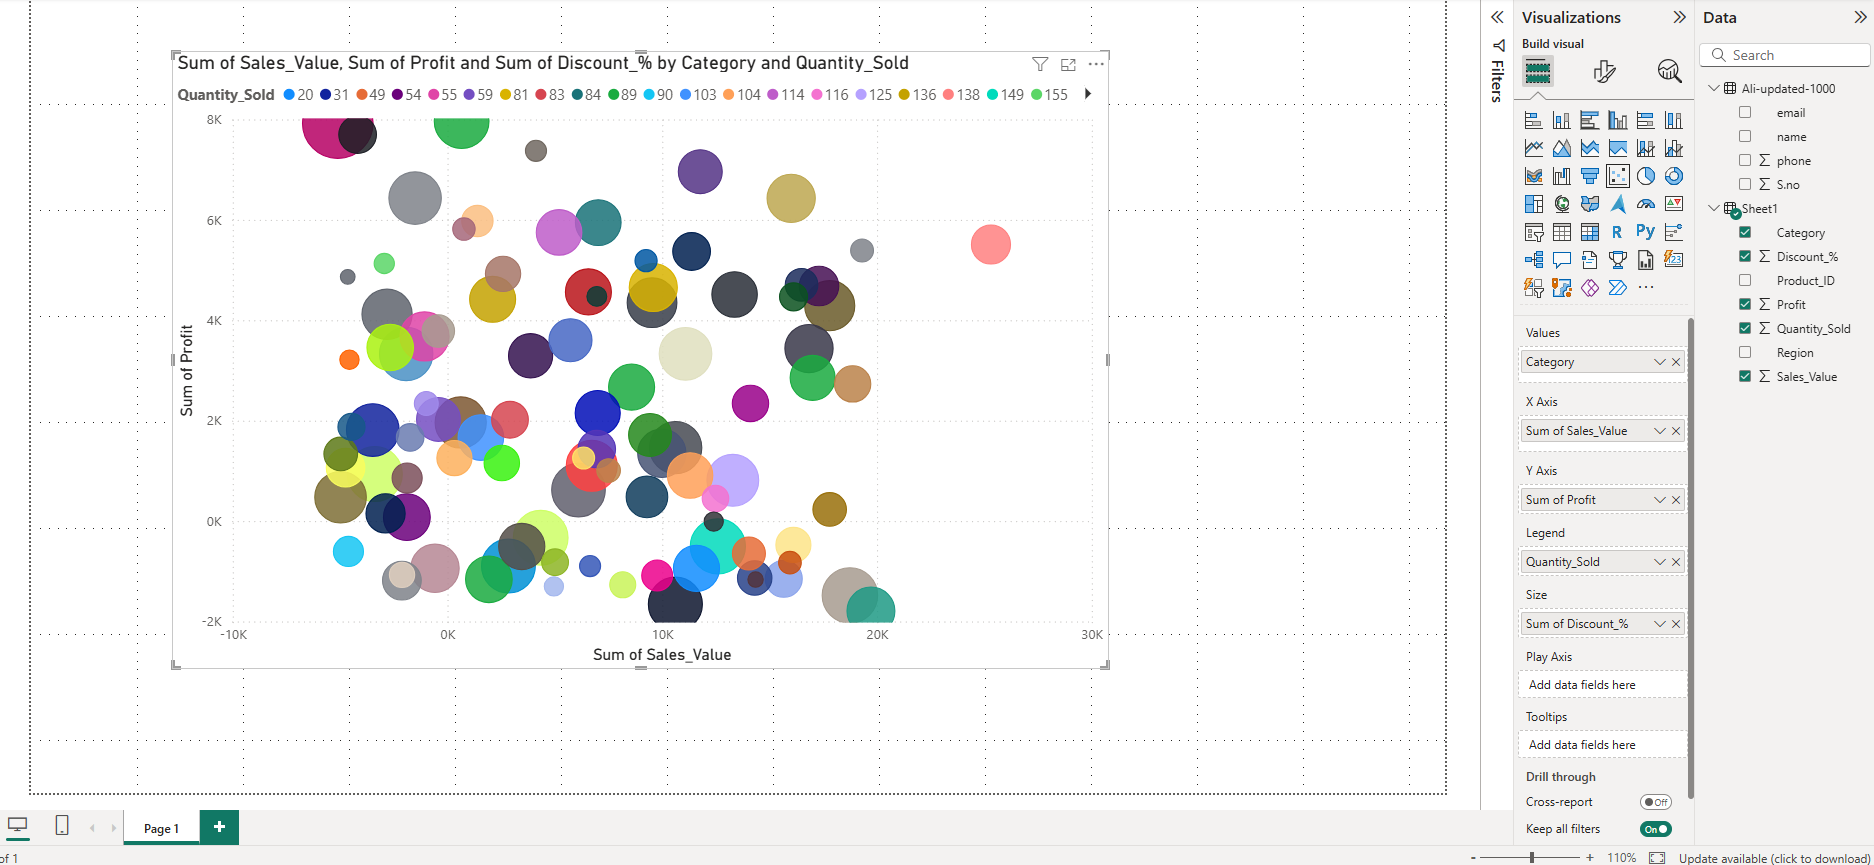
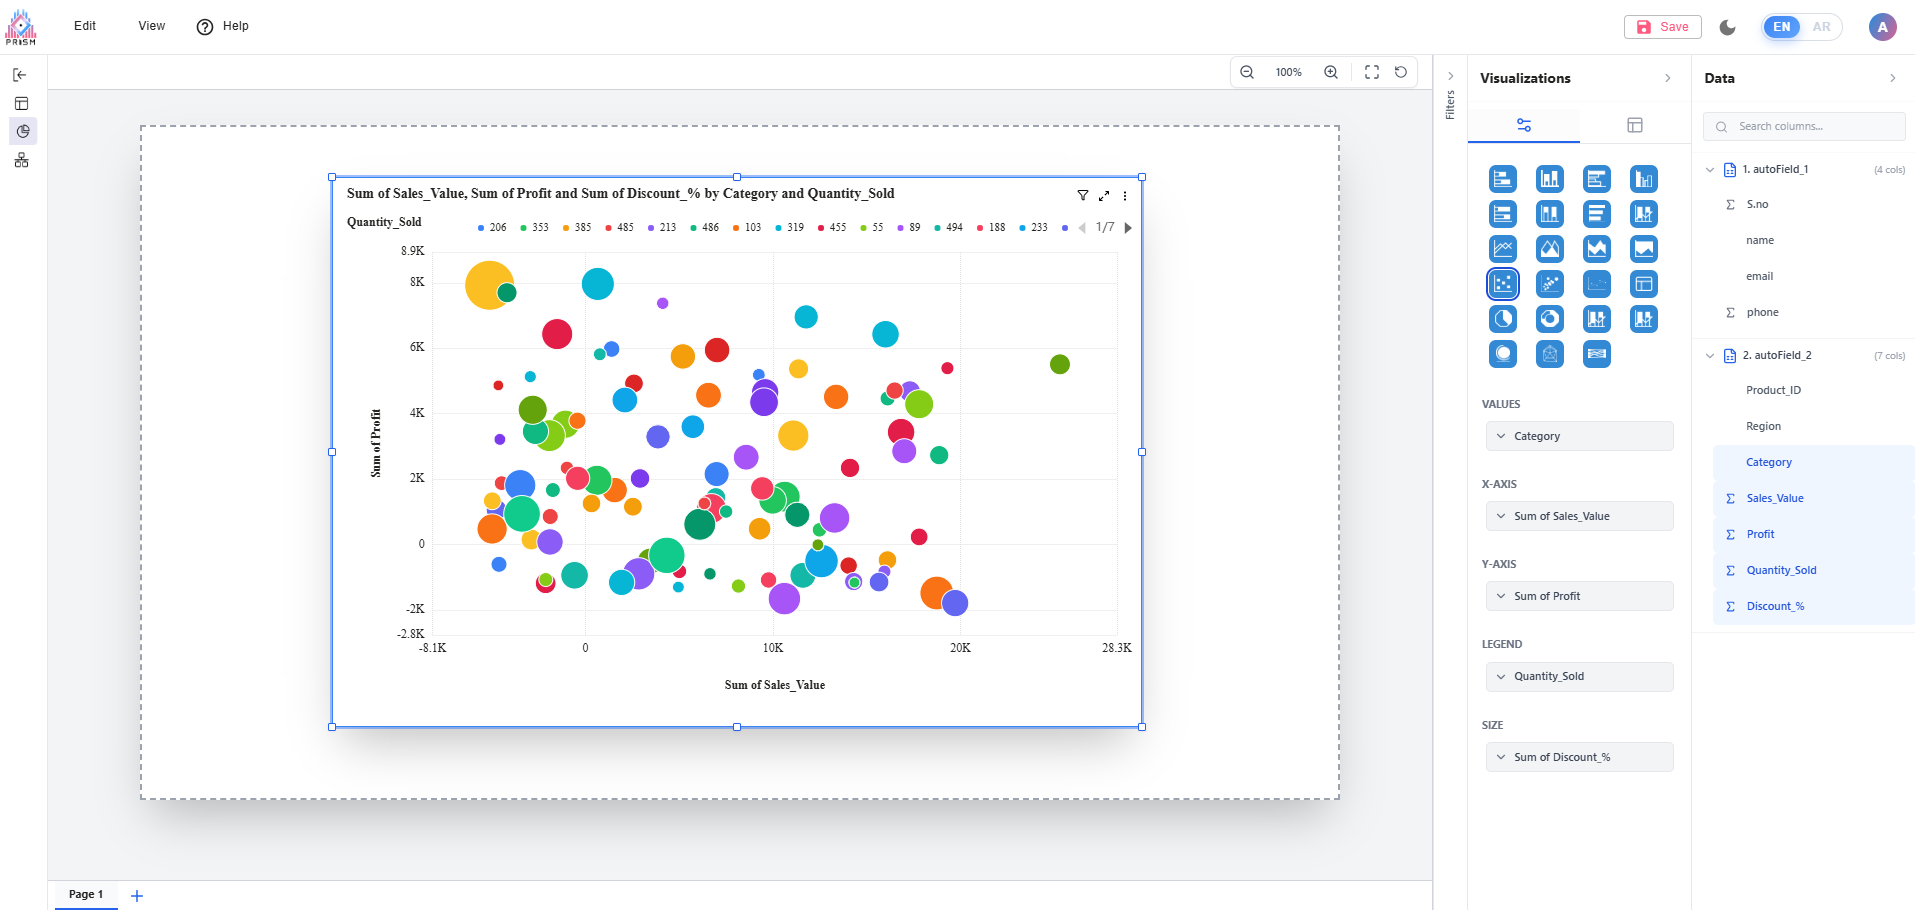
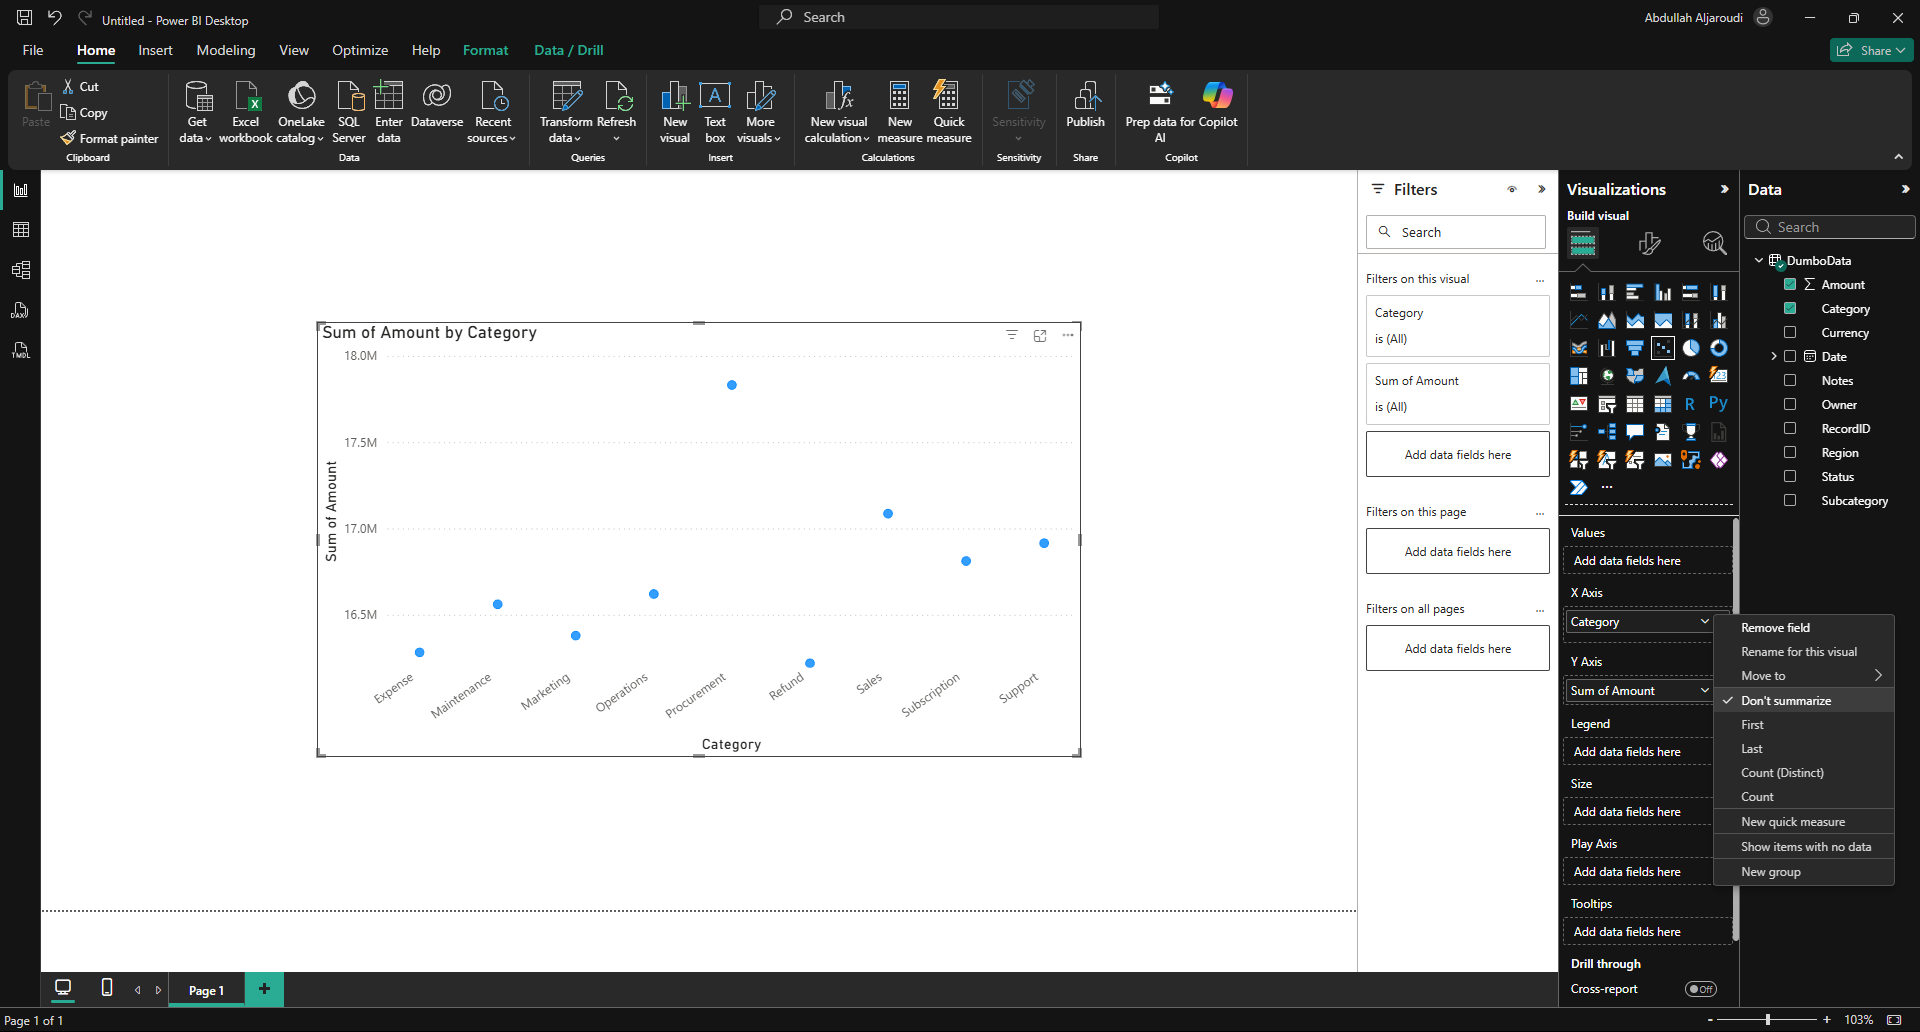
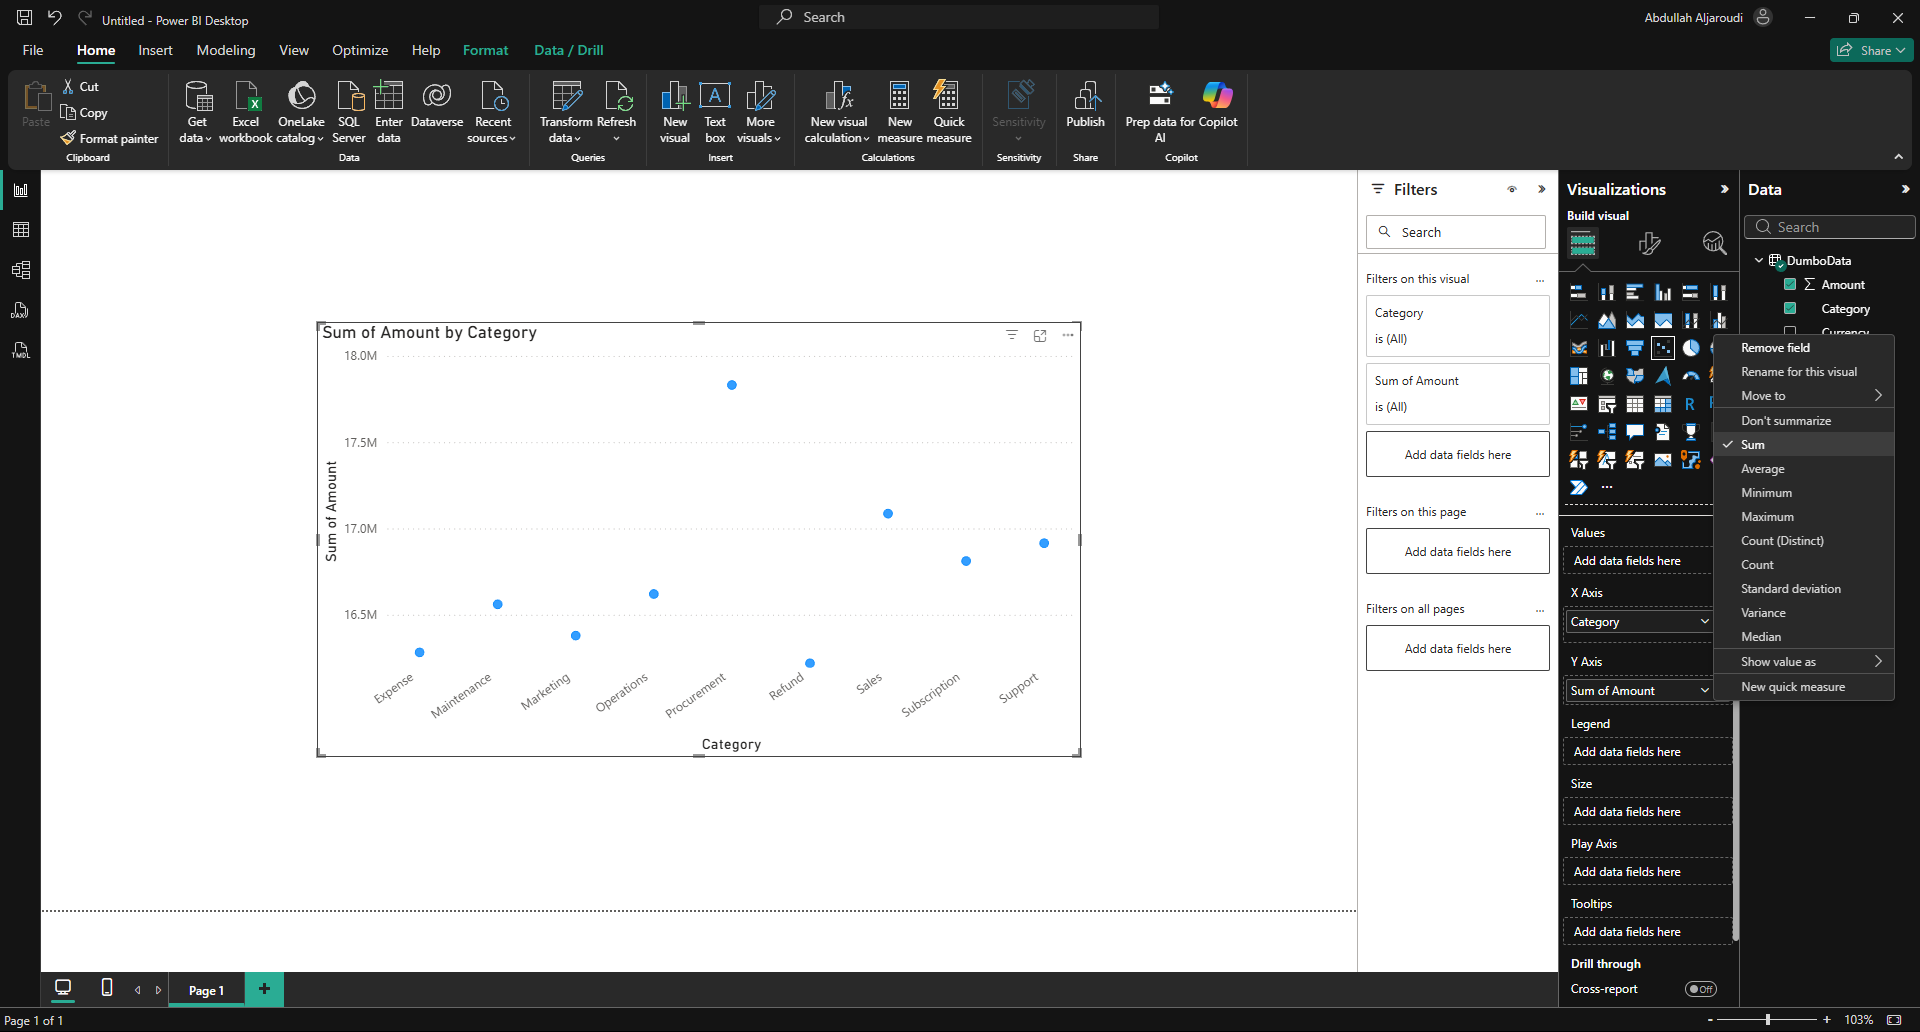
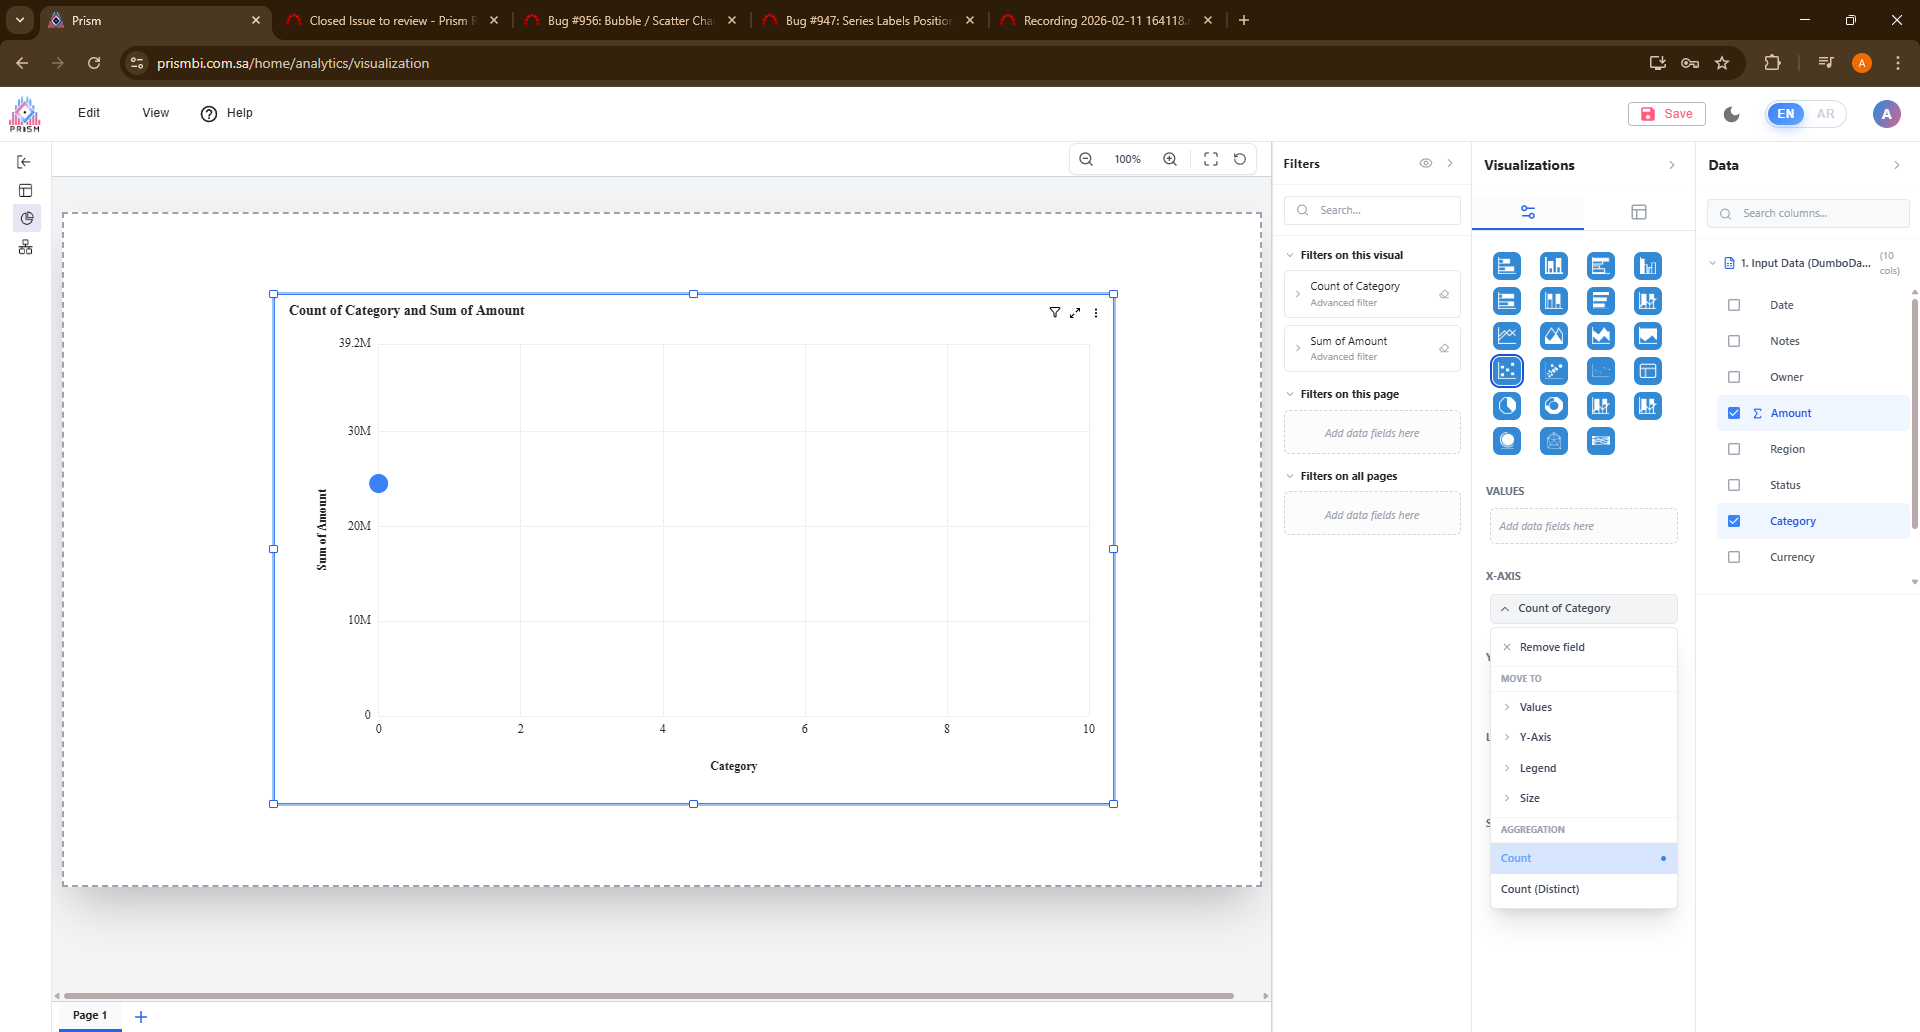
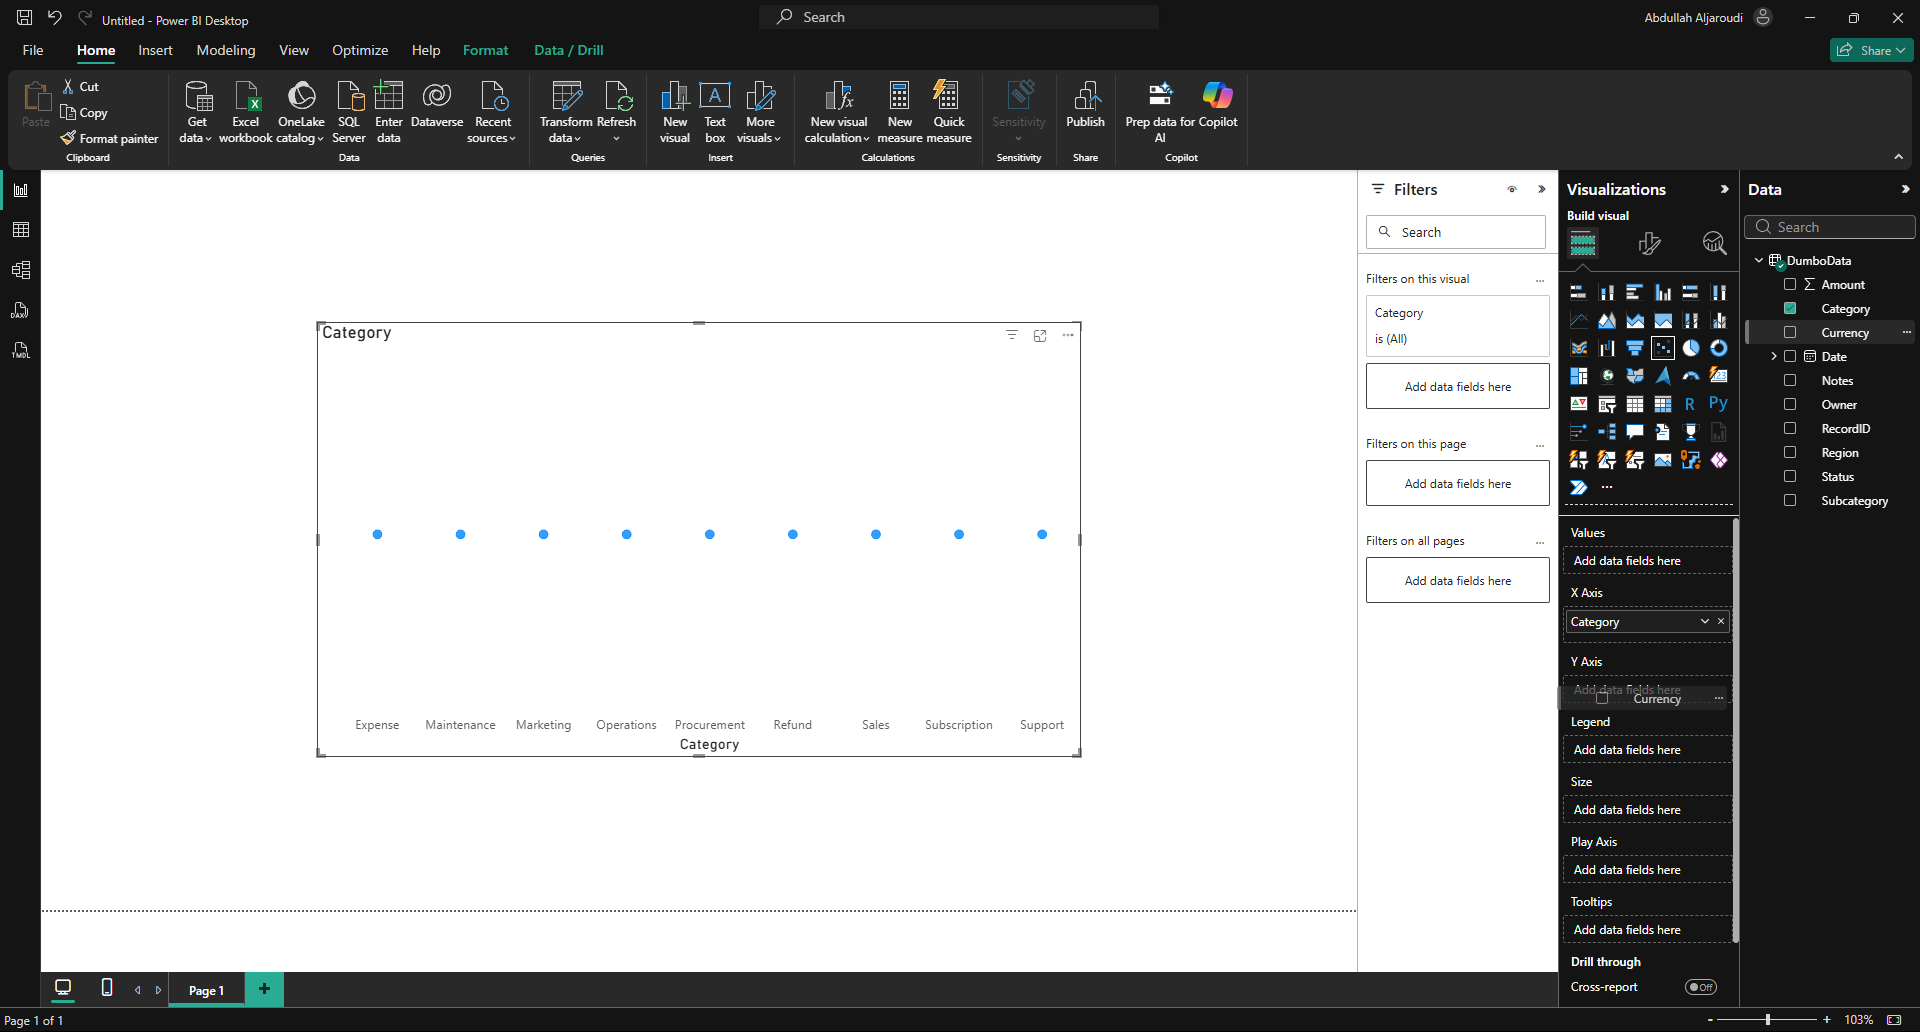
When the user creates a Bubble / Scatter Chart in Prism Visualization section using the same dataset and identical field mapping (X-axis, Y-axis, Values field, and Bubble Size field) as configured in Power BI, the resulting chart in Prism does not match the output shown in Power BI.
Despite using the same data source and same field placements, discrepancies are observed in bubble positioning, size representation, or aggregated values, leading to inconsistent visualization results between the two platforms.
Actual Result
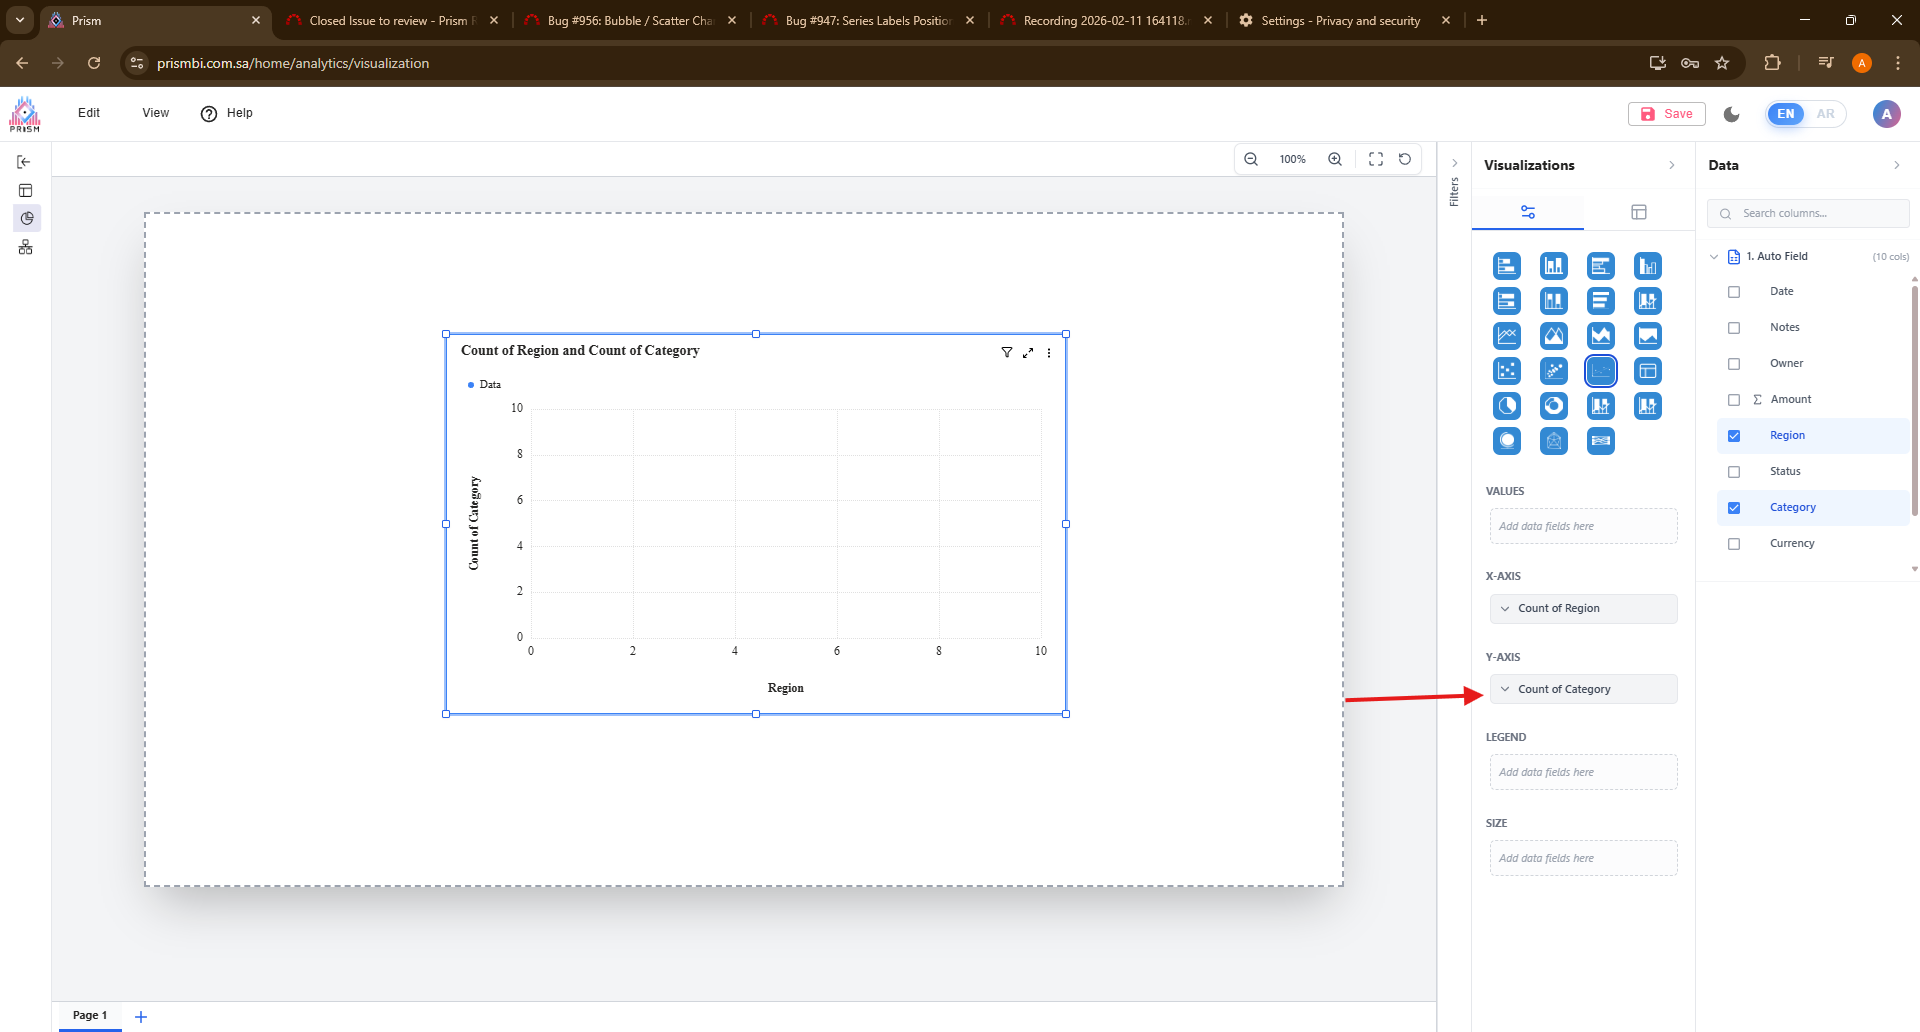
- Bubble / Scatter chart in Prism shows different results compared to Power BI.
- Bubble positions (X & Y values), size representation, or aggregated values do not align with Power BI output.
- Visual representation is inconsistent even though identical dataset and field configuration are used.
Expected Result
- Bubble / Scatter chart in Prism should produce the same visualization output as Power BI when:
- Same dataset is used
- Same fields are assigned to X-axis and Y-axis
- Same Values field is applied
- Same Bubble Size field is configured
Files
 Updated by
  Updated by
  Updated by
  Updated by
  Updated by
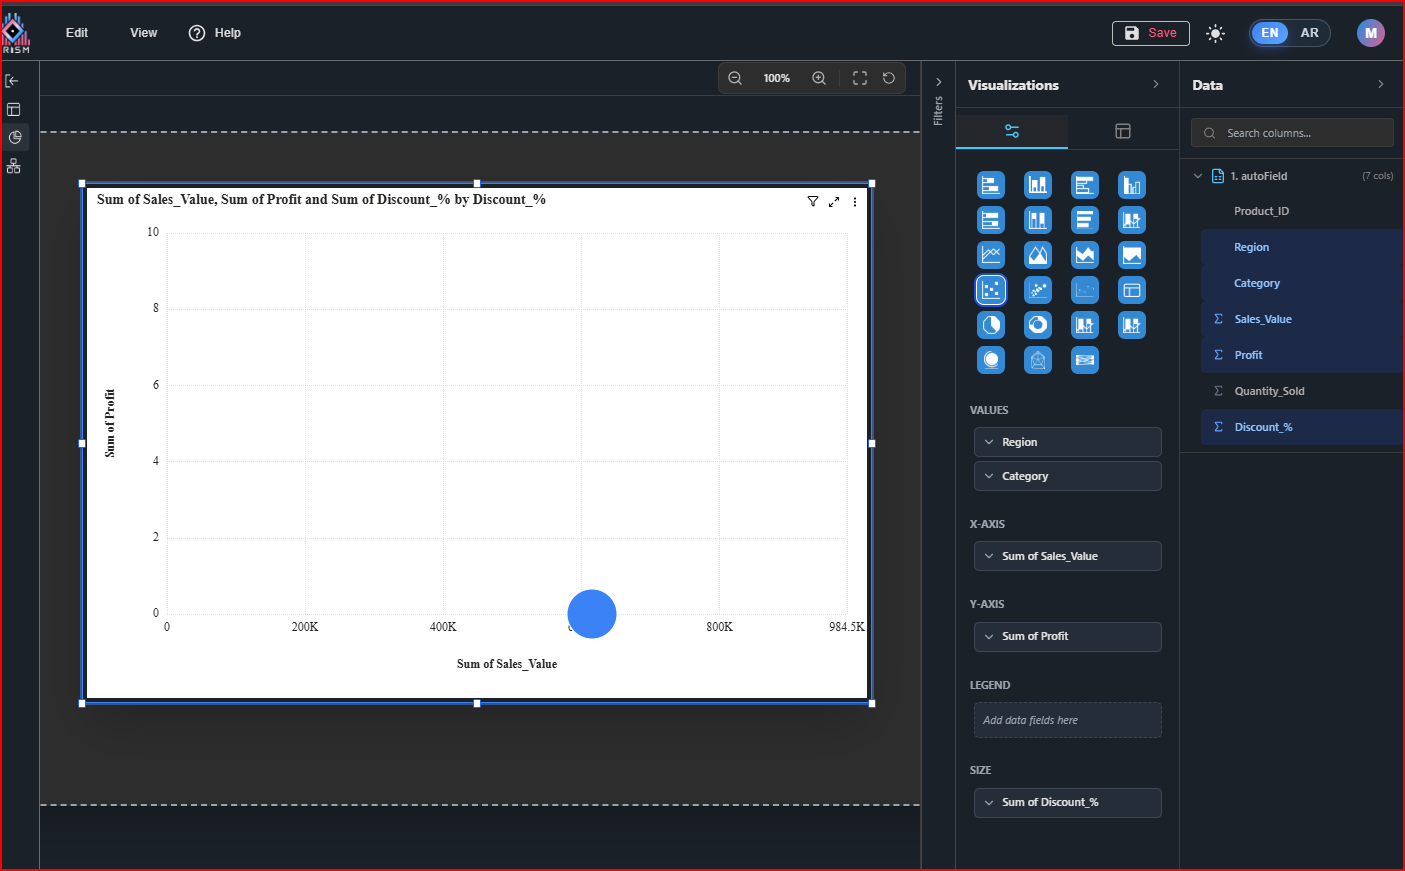
Actions