Bug #844
open
Aggregation Function for Boolean Data Type Not Displayed Correctly on Visualization Canvas
Description
Description:
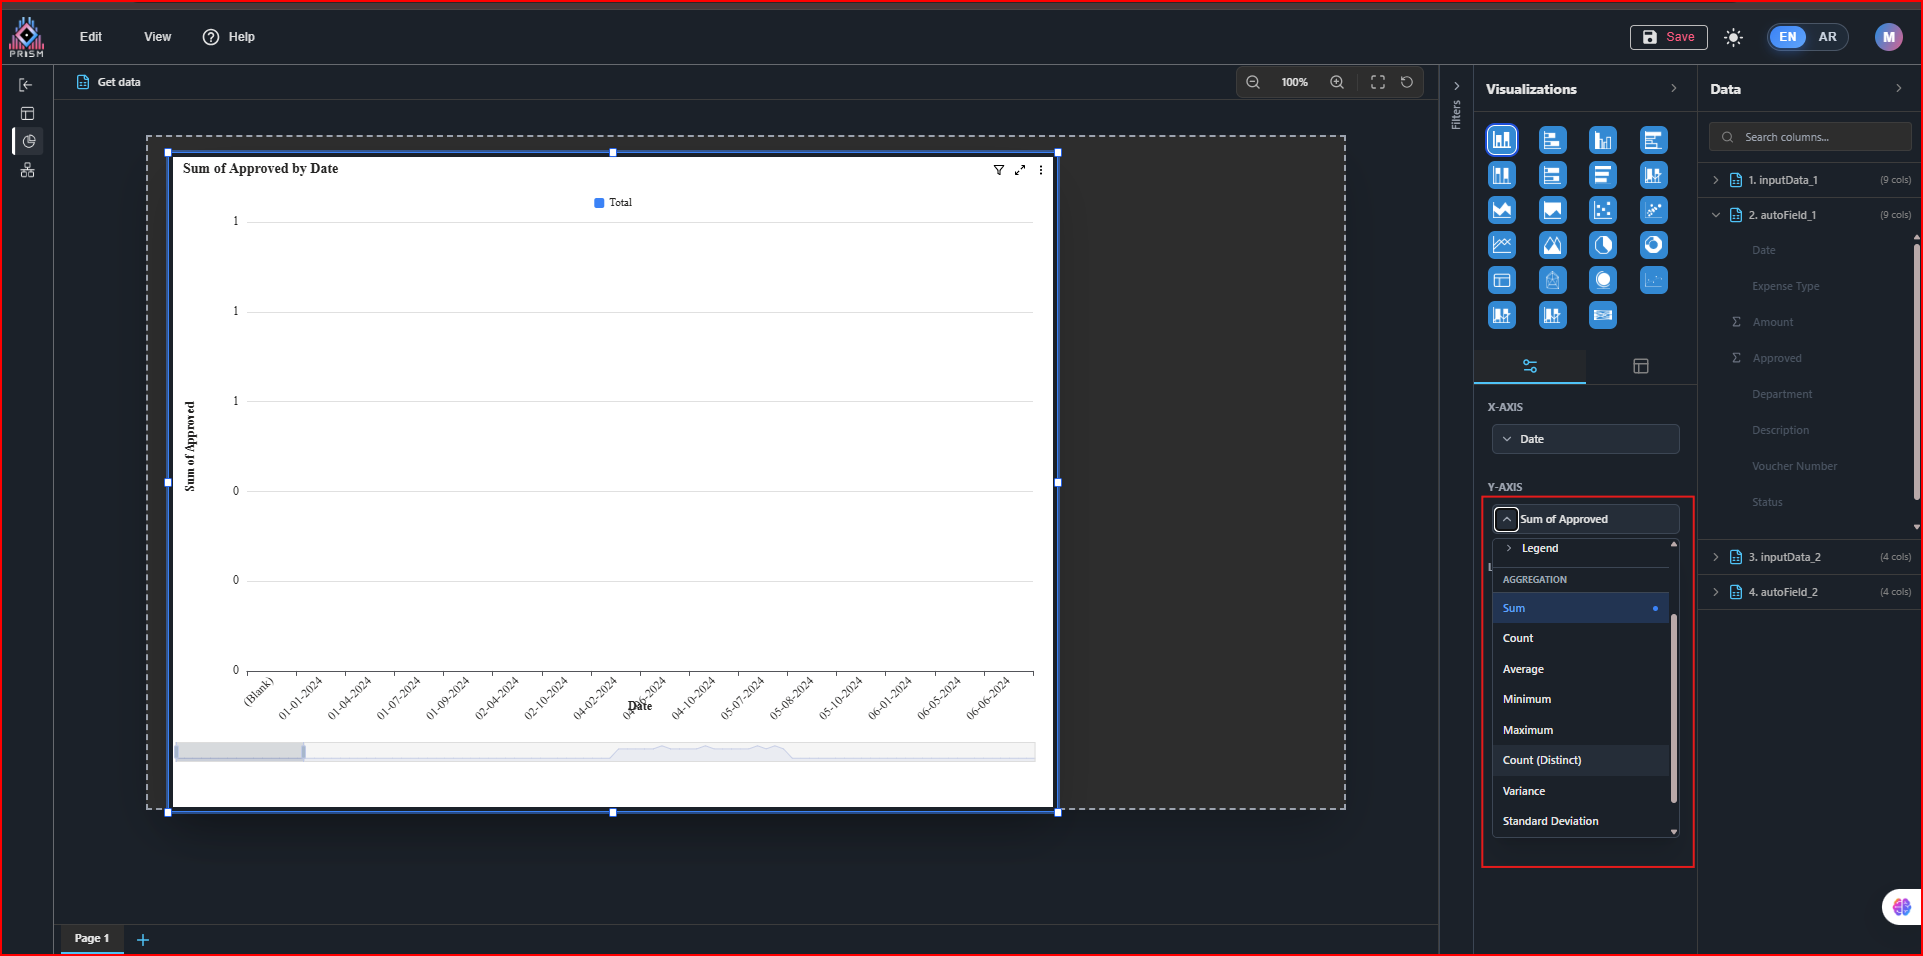
When using Boolean data (TRUE/FALSE) in the visualization canvas, the available aggregation functions do not correspond to Boolean operations. Instead, unrelated aggregation functions (such as SUM, AVERAGE, etc.) are displayed, which are not applicable for Boolean data. This prevents proper aggregation of Boolean fields in charts or visualizations.
Expected Result:
Only aggregation functions relevant to Boolean data type (e.g., COUNT, COUNT DISTINCT, TRUE/FALSE ratio, or logical operations) should be displayed.
Actual Result:
Aggregation functions unrelated to Boolean data type (e.g., SUM, AVERAGE) are displayed in the dropdown.
Files
 Updated by ALi RAZA 2 months ago
- Status changed from In Progress to Resolved
- % Done changed from 40 to 100
Boolean data type fields were showing all aggregation functions (SUM, AVG, MIN, MAX, etc.) which is incorrect behavior. Power BI only allows Count and Count Distinct for Boolean fields.
What We Fixed
Before (Wrong):
- Boolean fields (TRUE/FALSE, Yes/No) were classified as Measures
- All aggregation functions were available (SUM, AVG, MIN, MAX, COUNT, etc.)
- Users could select invalid aggregations for Boolean data
After (Correct):
- Boolean fields (TRUE/FALSE, Yes/No) are now classified as Dimensions
- Only valid aggregation functions are available: Count, Count Distinct
- Behavior now matches Power BI standards
How It Works Now
Field Type Classification Available Aggregations
TRUE/FALSE, Yes/No Dimension Count, Count Distinct
Numeric (0, 1, 100...) Measure SUM, AVG, MIN, MAX, COUNT
Text (Names) Dimension Count, Count Distinct
Result
- Boolean fields now behave exactly like Power BI
- Invalid aggregation options are no longer shown for Boolean data
- Users will see correct and meaningful aggregation choices
- No more confusion or misleading results when working with Boolean fields
 Updated by Fareena Anayat about 1 month ago
- Project changed from 16 to Prism Release 2
Updated by Fareena Anayat 16 days ago
- Status changed from Ready For QA to Waiting for Regression