Bug #955
open
Visualization - Visual - Data Labels
Description
there are so many errors in the data labels
Files
 Updated by ALi RAZA about 2 months ago
- Status changed from In Progress to Resolved
- % Done changed from 0 to 100
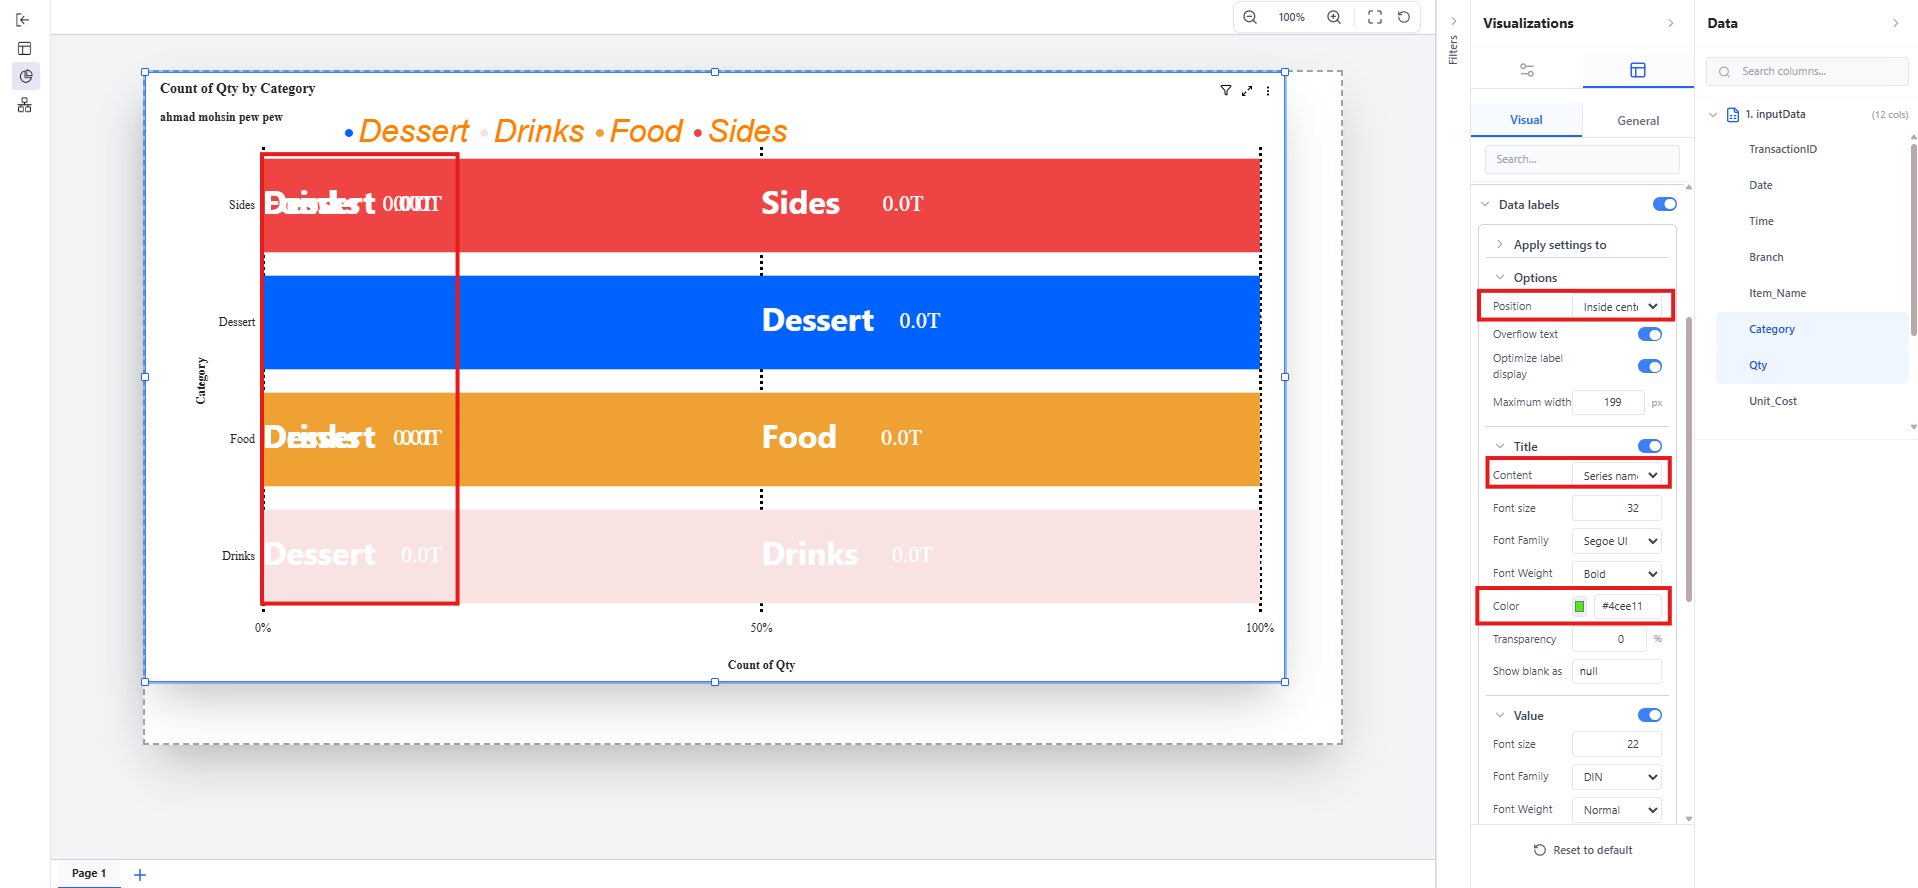
Data Labels Styling
"Apply Settings To" Feature Enhancement
We've resolved several issues related to data labels styling and the "Apply settings to" dropdown functionality to ensure it works exactly like Power BI:
Issues Fixed:
Title and Value Colors Not Applying
- Previously, custom colors selected for data label titles and values weren't being applied correctly to the charts
- Now, when you choose a color for titles or values, it displays exactly as configured
"Apply Settings To" Dropdown Not Working
- The "Apply settings to" option (which lets you choose between "All" or a specific field) wasn't functioning properly
- Users couldn't apply custom styling to individual series/fields as intended
Incomplete Styling Control
- When selecting a specific field in "Apply settings to", only some styling properties were being applied while others were ignored
- This has been expanded so that ALL styling properties now respect the "Apply settings to" selection
How It Works Now:
-
When "All" is selected: All custom styling (fonts, colors, sizes, backgrounds, transparency, layout, etc.) applies to every series in your chart
-
When a specific field is selected:
-
Only that field receives your custom styling
-
Other fields automatically display with default styling (gray color, standard font)
-
The "Show for this series" toggle controls whether non-selected fields are visible or hidden
-
Just the Detail option under the data labels are pending.
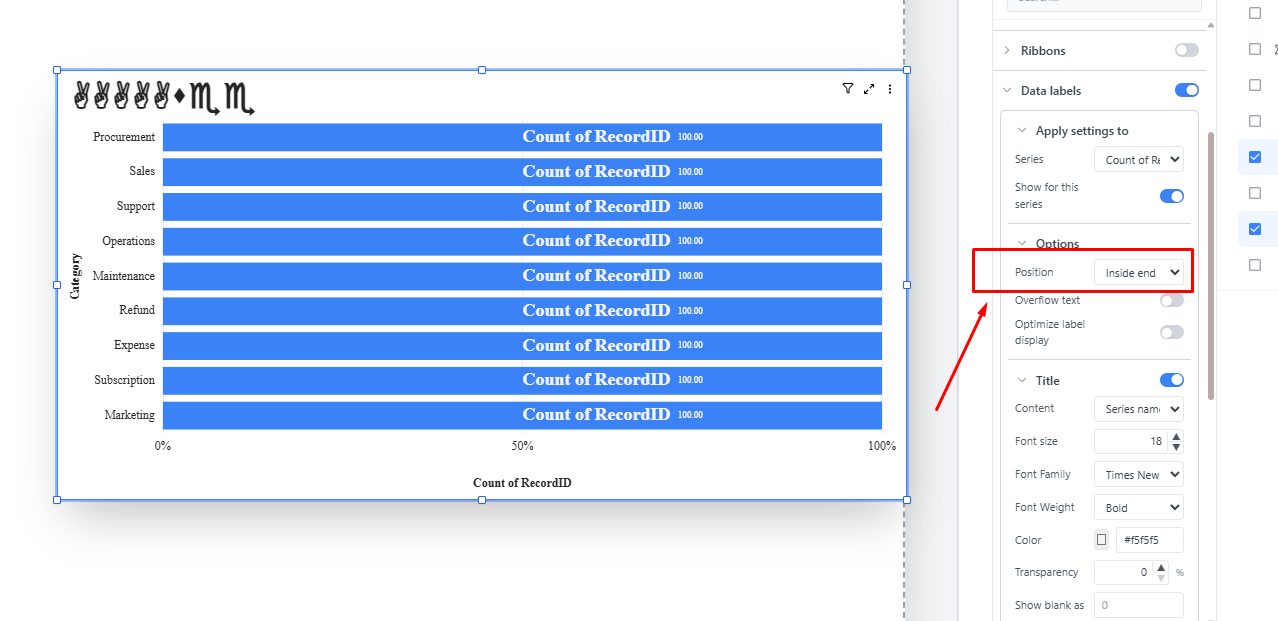
We resolved the chart label readability issue that was causing values to overlap and appear messy in bar and column visuals.
Now, labels are shown only within their own bar/column area, and when space is limited they are automatically shortened so they remain clear instead of spilling into neighboring sections.
For very small segments, labels are intelligently hidden to avoid clutter and preserve a clean view, similar to the polished behavior users expect from Power BI.
This fix has been applied consistently across all relevant bar and column chart variations, so the experience is now more uniform and easier to read across dashboards.
Updated by ALi RAZA about 2 months ago
- Status changed from Resolved to Ready For QA
 Updated by Maryam Farooq about 2 months ago
- Status changed from Ready For QA to Closed
 Updated by amer aljaroudi about 2 months ago
- File clipboard-202602260010-ry909.png clipboard-202602260010-ry909.png added
- Status changed from Closed to Feedback
Psition under Option still not solve !!!!
 Updated by Fareena Anayat about 1 month ago
- Project changed from 16 to Prism Release 2
Updated by Maryam Farooq 19 days ago
- Assignee changed from ALi RAZA to Maryam Farooq
Updated by Fareena Anayat 19 days ago
- Status changed from Ready For QA to Waiting for Regression